Questions have been raised about methodology adopted in Swachh Survekshan Report 2017. Instead of encouraging sustainable practices like segregation at source and recycle and reuse, the survey seems to have rewarded cities that are focussing on collection of unsegregated waste and transporting it to landfills.

These unsustainable practices are putting a burden on Indian economy.
 Did you know? In India, annual per capita cost of municipal solid waste management ranges from Rs 204 to Rs 900 for capital investment and from Rs 113 to Rs 269 for operation and maintenance.
✎ move mouse over the bars to know more
 ✎ Data source: Report of the Task Force on Waste to Energy (Volume I), In the context of Integrated MSW Management, Planning Commission, 2014
An extensive study by the Centre for Science and Environment has revealed some interesting facts and figures on financial aspects of solid waste management in India.
Need for waste Minimisation
Of the 143,449 tonnes per day (TPD) of Municipal Solid Waste (MSW) generated in 2014–2016 in India, 40–60 per cent is organic. It is assumed that 20 per cent of the total waste is recycled and does not enter the MSW stream to be processed.
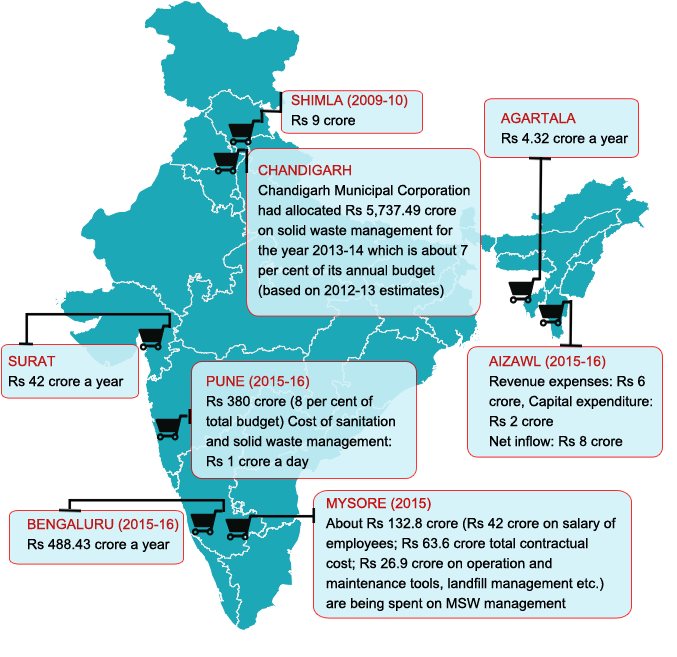
✎ FINANCING WASTE MANAGEMENT | Cities across the country are striving to adjust their budgets
This waste, at an average cost of Rs 1,000 per tonne, saves approximately Rs 10.7 crore per day. Waste minimisation results in savings, which accumulate through avoided collection, treatment and disposal costs.
✎ Data source: Not in my Backyard, CSE, 2016
|
Parameters |
Large cities (above 1.5 million) |
Mid-size towns (between 0.5-1.5 million) |
Small towns (less than 0.5 million) |
Hilly towns |
|
MSW management expenditure (Rs per capita per annum) |
165-175 |
150-180 |
120-150 |
350-400 |
|
MSW management cost per tonne (Rs) |
900-1,200 |
800-1,200 |
800-1,600 |
2,500-3,000 |
|
Ratio of workers per tonne of waste managed |
3.5-4.5 |
2.5-6 |
2.5-5 |
8-16 |
|
MSW management expenditure as percentage of total municipal revenue expenditure |
15-25 |
15-25 |
20-40 |
25-45 |
|
Salaries as percentage of overall MSW management costs |
45-55 |
60-70 |
65-75 |
80-90 |
|
Cost of primary collection as percentage of total MSW management expenditure |
25-30 |
40-70 |
30-40 |
20-40 |
|
Cost of transportation as percentage of total MSW management expenditure |
20-25 |
10-20 |
10-15 |
15-25 |
|
Cost of MSW management contract as percentage of total MSW management expenditure |
35-40 |
25-30 |
5-10 |
<5 |
✎ Data source: Improving Management of Solid Waste in India, World Bank, May 2006
Funds allocated under Swachh Bharat Abhiyan
The campaign was launched on 2nd October 2014. Rs 62,009 crore likely to be spent on the Swachh Bharat Mission programme, the Centre will contribute Rs 14,623 crore, out of which, Rs 7,366 crore will be spent on solid waste management, Rs 4,165 crore on individual household toilets, Rs 1,828 crore on public awareness and Rs 655 crore on community toilets.
Did you know? Urban bodies spend between Rs 500 and Rs 1,500 per tonne on solid waste collection, transportation, treatment and disposal
Data source:
✿ Municipal Solid Waste Manual, 2016
✿ Not in my Backyard, CSE, 2016
✿ Swachhta Status Report 2016, NSSO
✿ Assessment and quantification of plastics waste generation in major cities, 2015, CPCB
✿ Report of the Task Force on Waste to Energy (Volume I), In the context of Integrated MSW Management,
Planning Commission, 2014
✿ What a Waste : A Global Review of Solid Waste Management, World Bank