The impacts of climate change at 1.5C, 2C and beyond
Carbon Brief has extracted data from around 70 peer-reviewed climate studies to show how global warming is projected to affect the world and its regions.

Carbon Brief has extracted data from around 70 peer-reviewed climate studies to show how global warming is projected to affect the world and its regions.
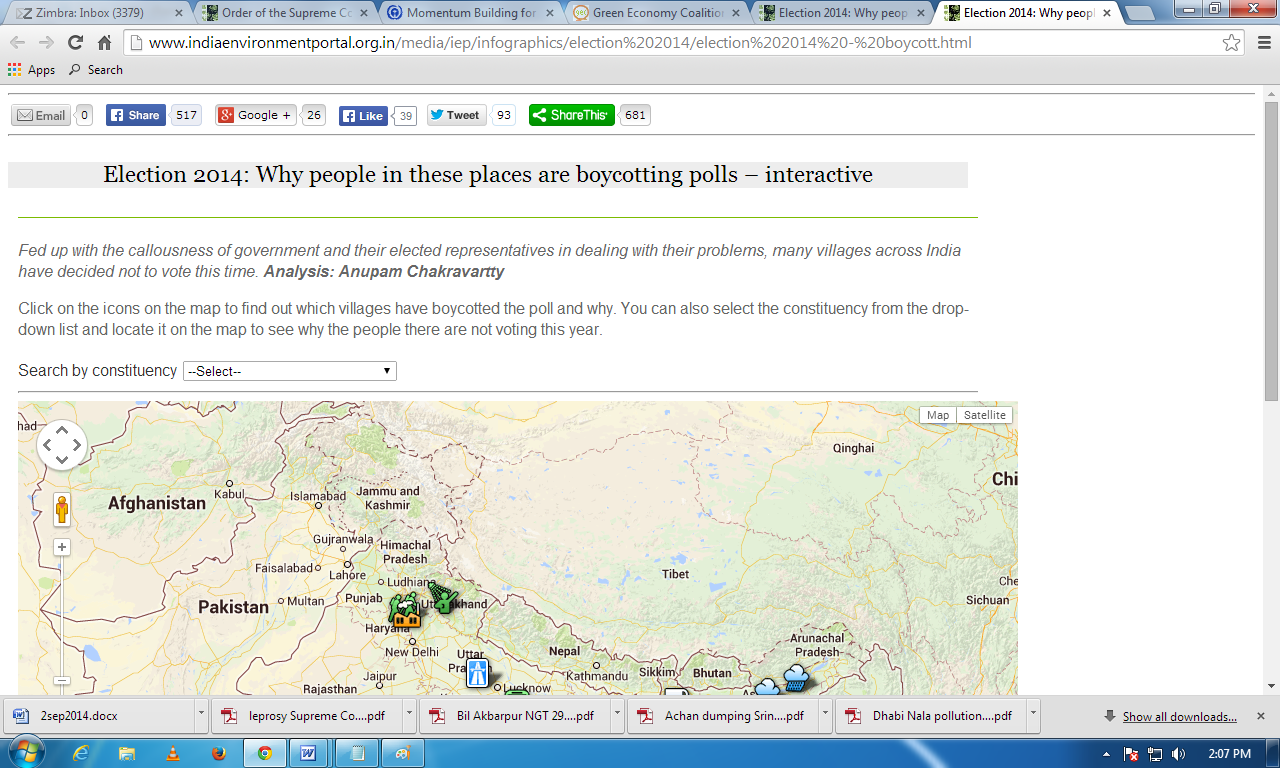
Fed up with the callousness of government and their elected representatives in dealing with their problems, many villages across India have decided not to vote this time.
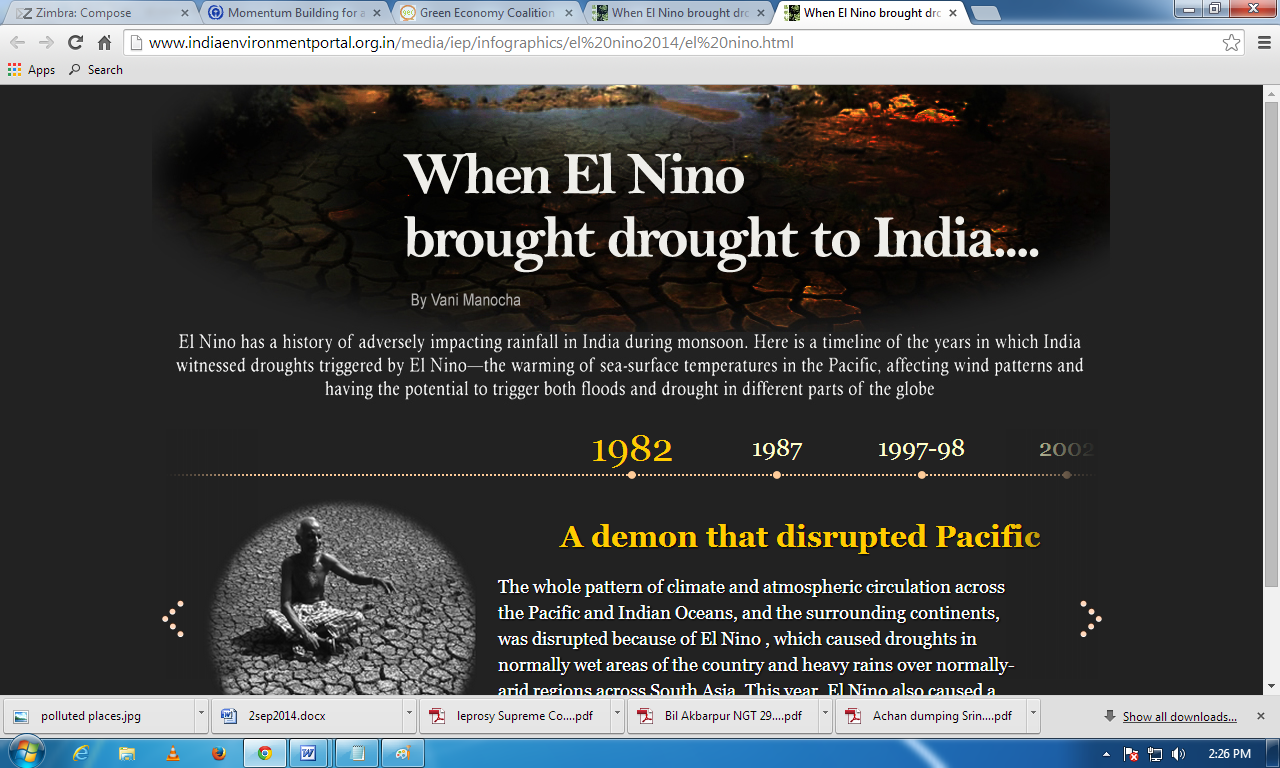
El Nino has a history of adversely impacting rainfall in India during monsoon. Here is a timeline of the years in which India witnessed droughts triggered by El Nino—the warming of sea-surface temperatures
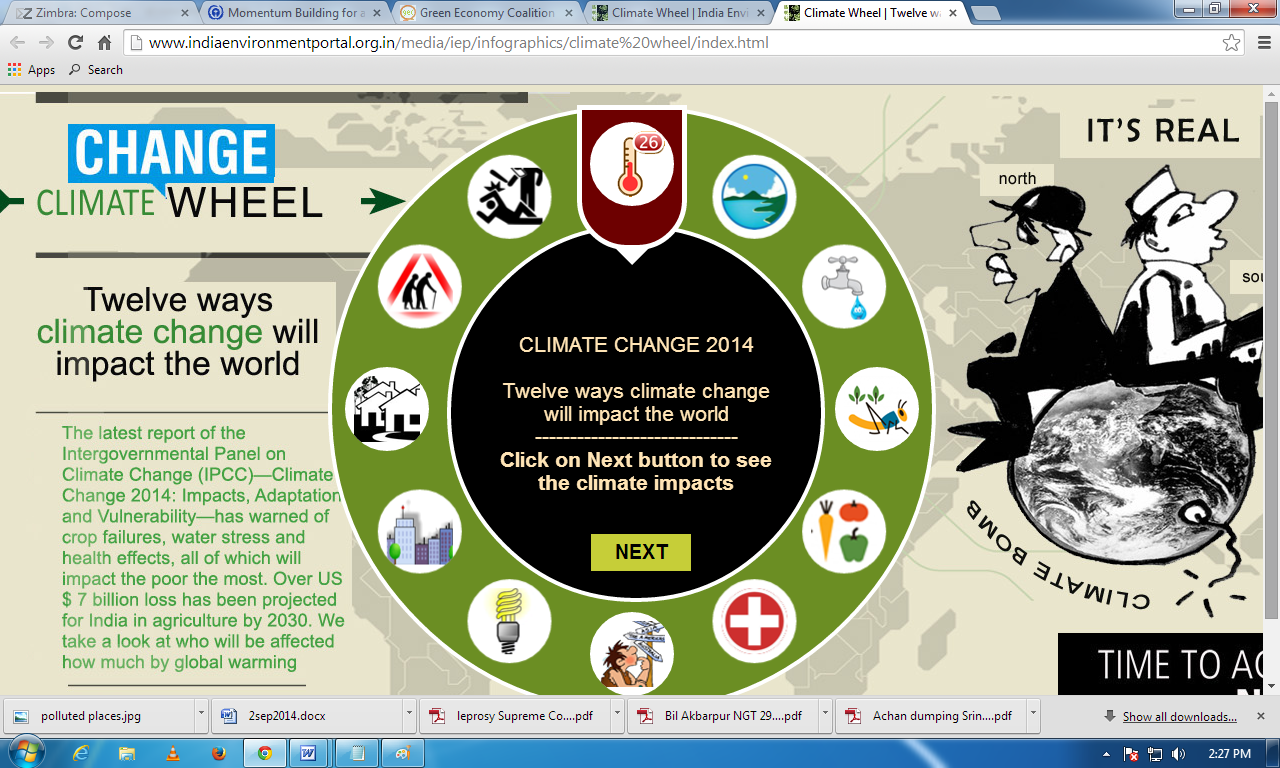
The latest report of the Intergovernmental Panel on Climate Change (IPCC) - Climate Change 2014: Impacts, Adaptation and Vulnerability-has warned of crop failures, water stress and health effects, all
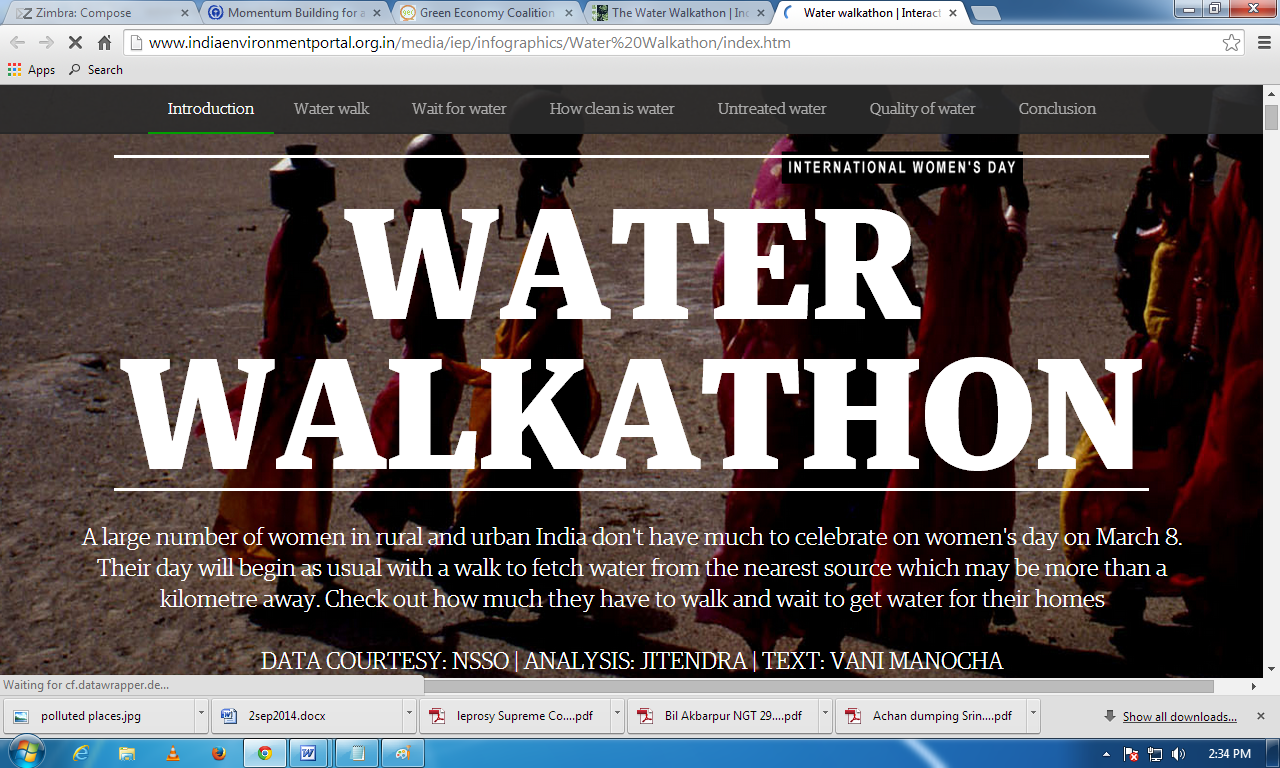
A large number of women in rural and urban India don't have much to celebrate on women's day on March 8. Their day will begin as usual with a walk to fetch water from the nearest source which may be more
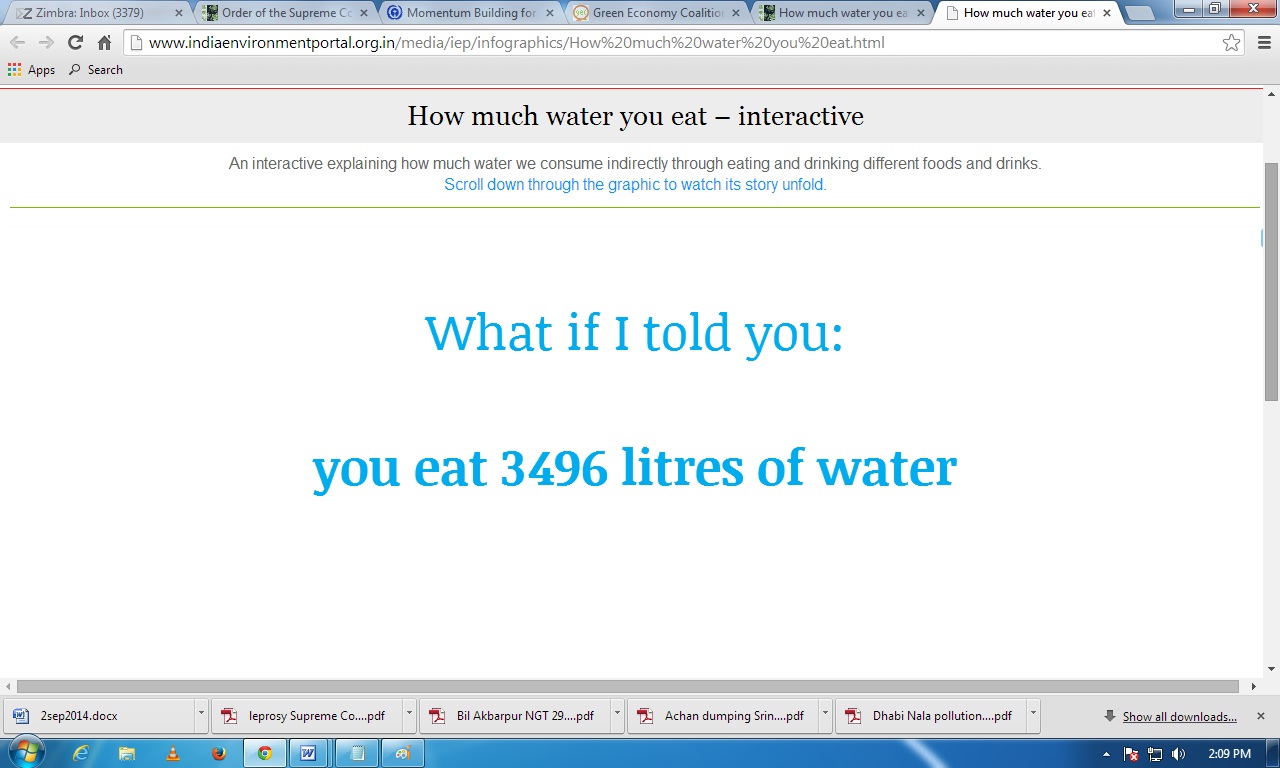
Italian graphic design specialist Angela Morelli has put together an interactive explaining how much water we consume indirectly through eating and drinking different foods and drinks.
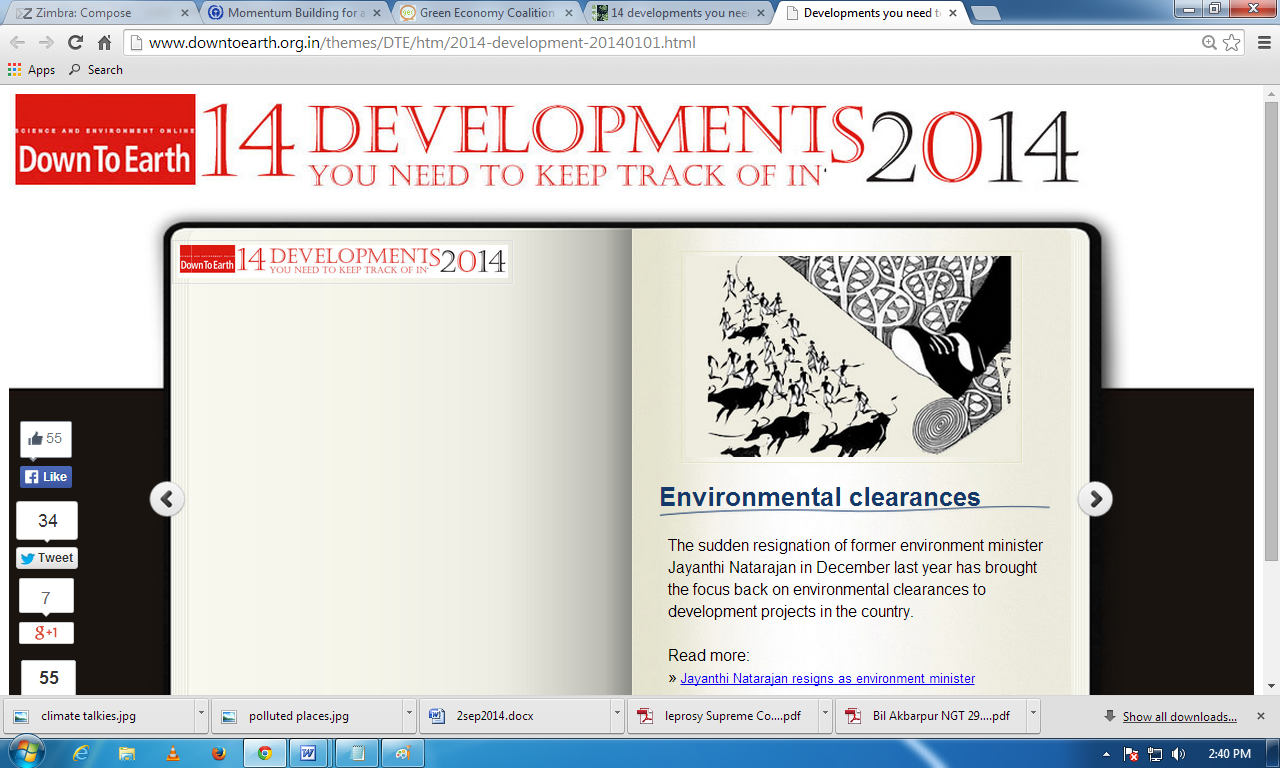
The year ahead is critical from the point of view on environment and development. Click on this interactive for the top 14 developments you need to keep track of in 2014.
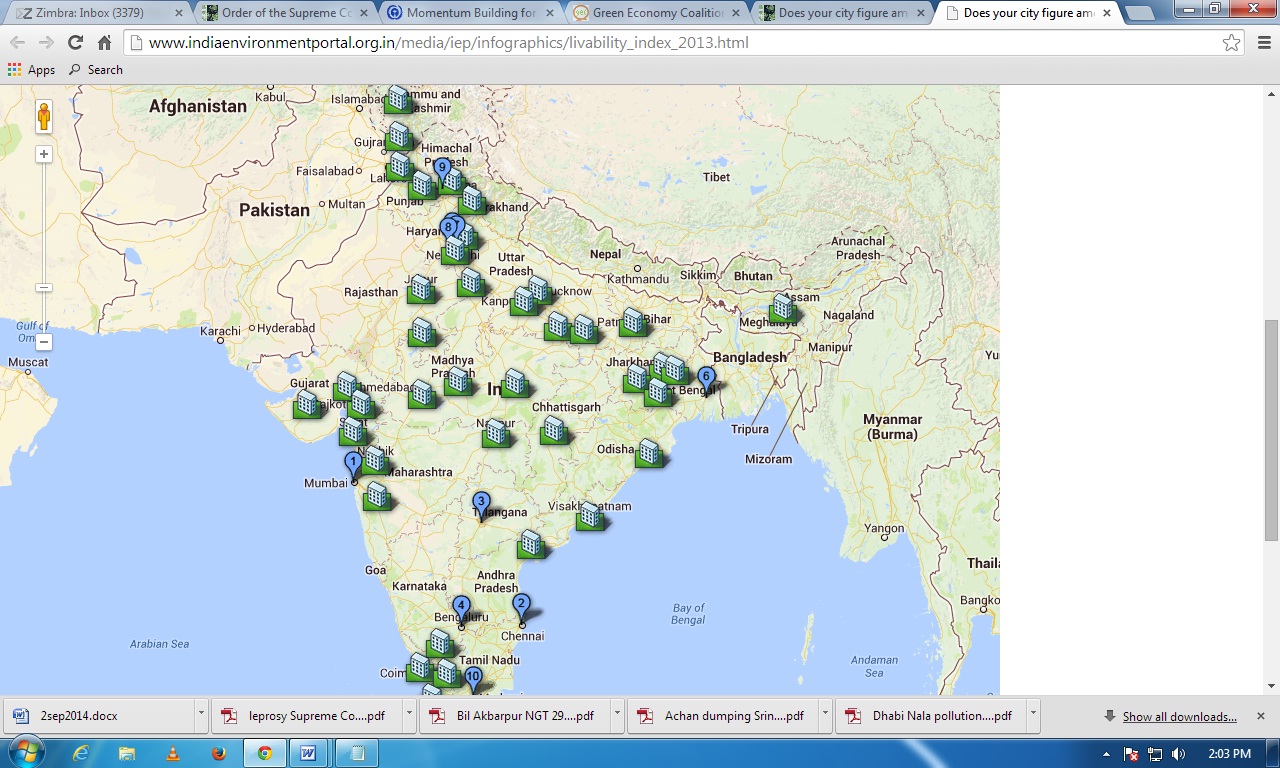
<p>Delhi, the national capital, is the fifth most liveable city in India, according to the Liveability Index 2013 report. Which are the top three liveable Indian cities? Is your city among the 50 liveable
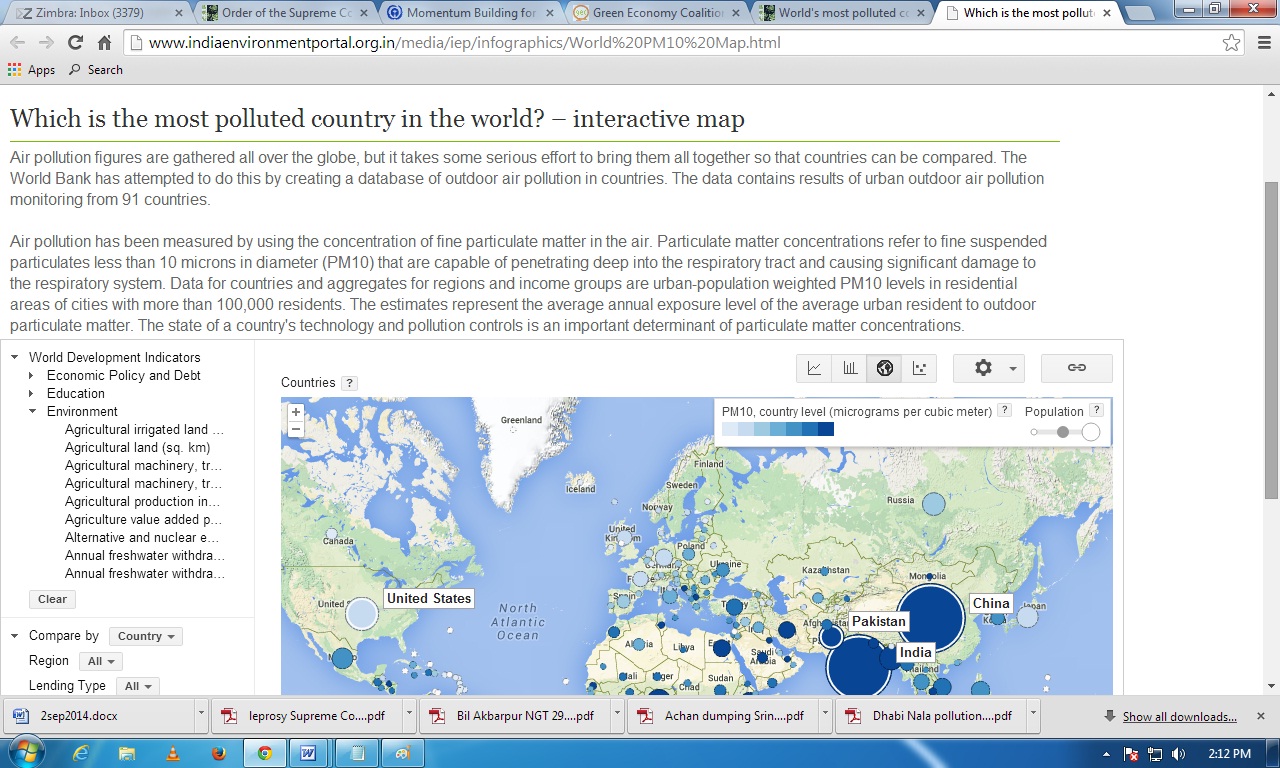
Which is the most polluted country in the world? Click here and see this interactive to find out.
From temperatures as low as -36C in Russia to some of the wettest weather in the UK’s history, this map shows the extreme weather events of january 2014 from around the world. The data was sourced from
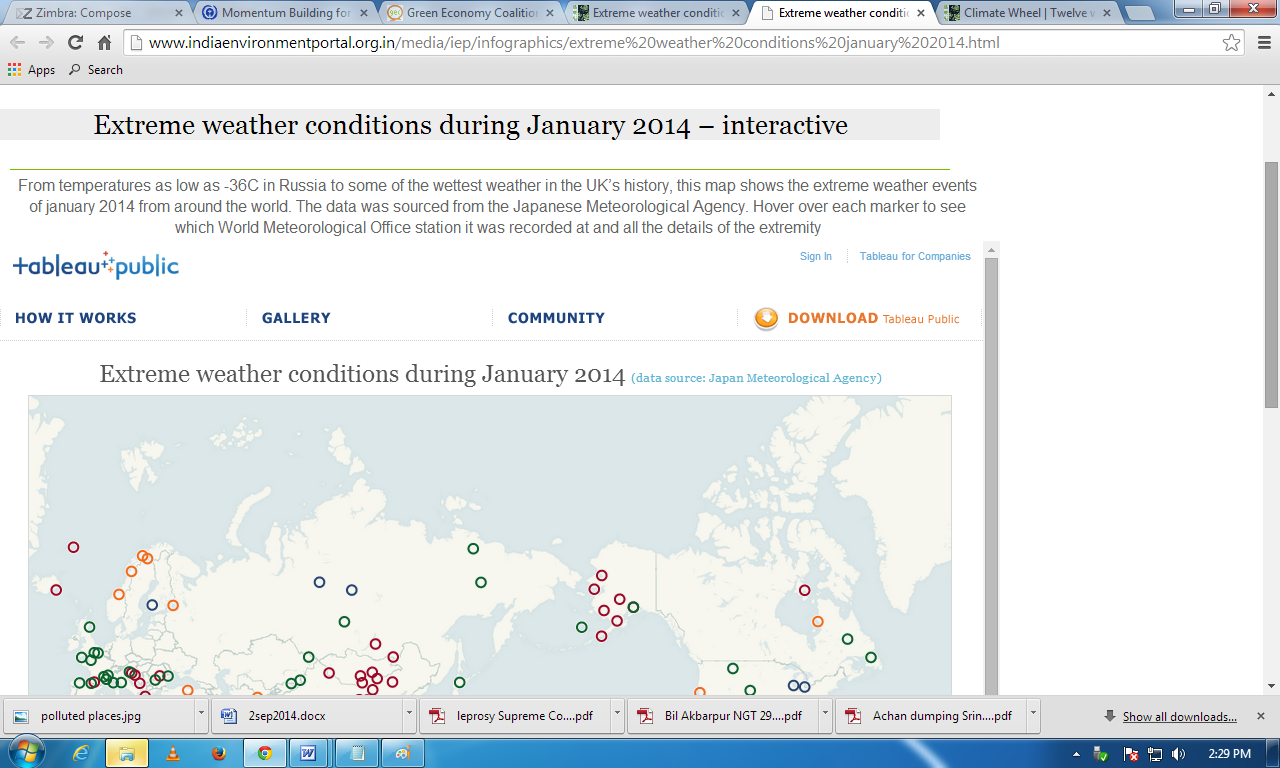
From temperatures as low as -36C in Russia to some of the wettest weather in the UK’s history, this map shows the extreme weather events of january 2014 from around the world. The data was sourced from